A Simple Linear Regression is a straight line relationship between dependent and independent variable.
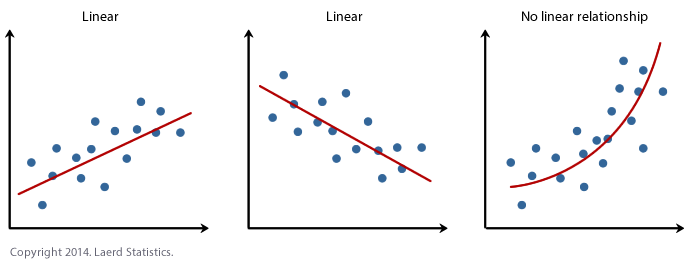
The above diagram describes, fitting a straight line to describe the relation between two variables. The points on the graph are randomly chosen observations of the two variables. The straight line describes the general movement of the data - an increase in Y(dependent) corresponding to an increase in X(independent). An inverse straight line relationship is also possible.
Simple Linear Regression Model:
Model must contain two parameters i.e. population intercept and population slope.

The method that will give us good estimates of the regression coefficients is the method of least squares.
We should come up with a line that is best fit with the data points and minimizes the errors i.e. we should minimize the sum of squared errors (SSE as in ANOVA)
Below are few formulas for calculating SSE, bo and b1.

Note:
Y is the dependent and X is the independent variable
Example:
A study was conducted to determine the relation between travel(X) and charges(Y) on American Express card as they believe that their cardholders use their card most extensively than other cards.
Below is the data:
- X and Y are Miles and Dollars respectively.
- X square , Y square and XY for easy calculation.

Let us see the manual calculation for building the linear regression model i.e. Y=bo + b1X

Our model is Y=274.85 + 1.26X
Let us check the same in tools like SAS and R
SAS
Below is the code and the output which gives the same result as manual calculation
Code:
FILENAME REFFILE '/home/test/linear_reg_data.xlsx';
PROC IMPORT DATAFILE=REFFILE
DBMS=XLSX
OUT=WORK.IMPORT;
GETNAMES=YES;
RUN;
proc reg data=import;
model dollars=miles;
run;
Output:

R Studio
Code
library(readxl)
linear_reg_data <- read_excel("C:/Users/pc/Desktop/linear_reg_data.xlsx")
View(linear_reg_data)
plot(dollars~miles, data=linear_reg_data)
model1=lm(dollars~miles,data=linear_reg_data)
summary(model1)
Output:
Call:
lm(formula = dollars ~ miles, data = linear_reg_data)
Residuals:
Min 1Q Median 3Q Max
-588.79 -263.96 63.52 200.68 498.66
Coefficients:
Estimate Std. Error t value Pr(>|t|)
(Intercept) 274.84969 170.33684 1.614 0.12
miles 1.25533 0.04972 25.248 <2e-16 ***
---
Signif. codes: 0 ‘***’ 0.001 ‘**’ 0.01 ‘*’ 0.05 ‘.’ 0.1 ‘ ’ 1
Residual standard error: 318.2 on 23 degrees of freedom
Multiple R-squared: 0.9652, Adjusted R-squared: 0.9637
F-statistic: 637.5 on 1 and 23 DF, p-value: < 2.2e-16
The model is same in all the tools and manual calculation 😊😊