Pages

Monday, April 15, 2019

Statistics : Linear Regression made easy !!


A Simple Linear Regression is a straight line relationship between dependent and independent variable.
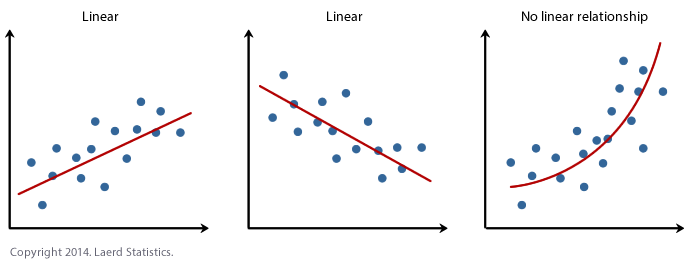

Image result for regression line

The above diagram describes, fitting a straight line to describe the relation between two variables. The points on the graph are randomly chosen observations of the two variables. The straight line describes the general movement of the data - an increase in Y(dependent) corresponding to an increase in X(independent). An inverse straight line relationship is also possible.

Simple Linear Regression Model:


Model must contain two parameters i.e. population intercept and population slope.


Image result for simple linear regression model


The method that will give us good estimates of the regression coefficients is the method of least squares.

We should come up with a line that is best fit with the data points and minimizes the errors i.e. we should minimize the sum of squared errors (SSE as in ANOVA)

Below are few formulas for calculating SSE, bo and b1.

Note:

Y is the dependent  and X is the independent variable


Example:

A study was conducted to determine the relation between travel(X) and charges(Y) on American Express card as they believe that their cardholders use their card most extensively than other cards.

Below is the data:
  • X and Y are Miles and Dollars respectively. 
  • X square , Y square and XY for easy calculation. 


Let us see the manual calculation for building the linear regression model i.e. Y=bo + b1X


Our model is Y=274.85 + 1.26X


Let us check the same in tools like SAS and R

SAS


Below is the code and the output which gives the same result as manual calculation

Code:


FILENAME REFFILE '/home/test/linear_reg_data.xlsx';

PROC IMPORT DATAFILE=REFFILE
DBMS=XLSX
OUT=WORK.IMPORT;
GETNAMES=YES;
RUN;

proc reg data=import;
model dollars=miles;
run;

Output:


R Studio


Code


library(readxl)
linear_reg_data <- read_excel("C:/Users/pc/Desktop/linear_reg_data.xlsx")
View(linear_reg_data)

plot(dollars~miles, data=linear_reg_data)

model1=lm(dollars~miles,data=linear_reg_data)
summary(model1)


Output:


Call:
lm(formula = dollars ~ miles, data = linear_reg_data)

Residuals:
    Min      1Q      Median      3Q     Max 
-588.79 -263.96   63.52     200.68  498.66 

Coefficients:
                    Estimate     Std. Error    t value    Pr(>|t|)    
(Intercept) 274.84969    170.33684   1.614      0.12    
miles         1.25533        0.04972       25.248   <2e-16 ***
---
Signif. codes:  0 ‘***’ 0.001 ‘**’ 0.01 ‘*’ 0.05 ‘.’ 0.1 ‘ ’ 1

Residual standard error: 318.2 on 23 degrees of freedom

Multiple R-squared:  0.9652, Adjusted R-squared:  0.9637 

F-statistic: 637.5 on 1 and 23 DF,  p-value: < 2.2e-16


The model is same in all the tools and manual calculation 😊😊


Monday, April 1, 2019

SAS Example : Daily Sales Report Automation

The purpose of this post is to give an idea on automation of report generation. 


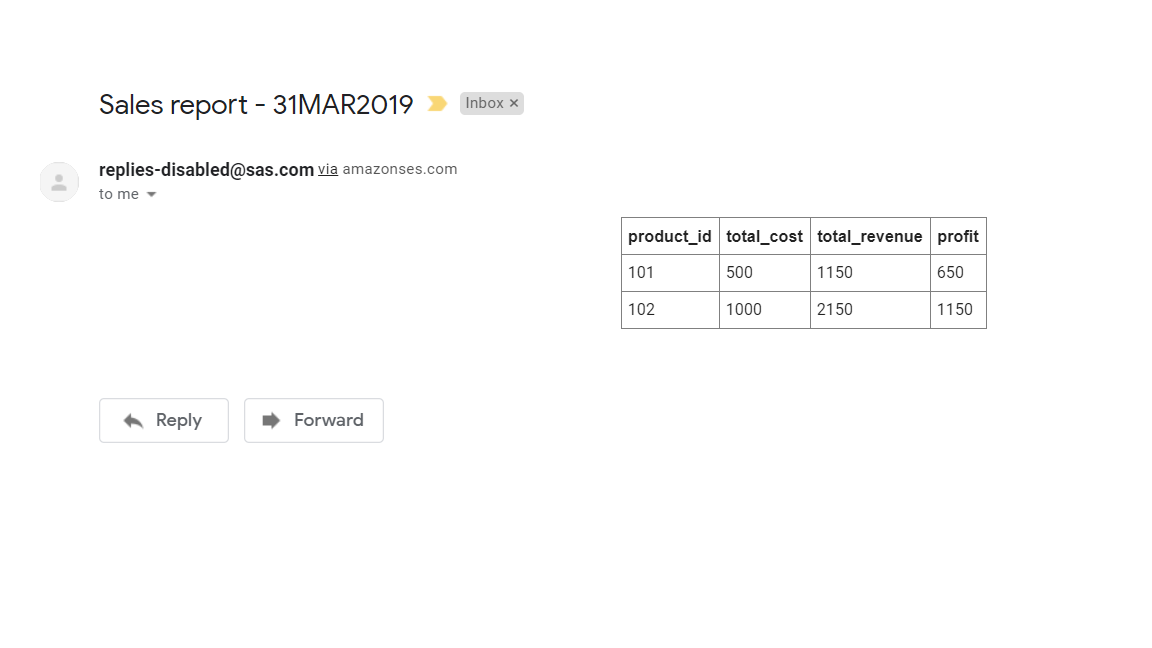
The below code generates Automated Sales Summary Email based on discrete sales figures on a product, place, cost & revenue by utilizing macros.


Create a sample sales data as below:


data sales;
input product_id place $ product_cost product_revenue ;
date=today()-1;format date date9.;
cards;
101 goa 100 200
101 punjab 100 250
101 mumbai 100 300
101 chennai 100 175
101 kerala 100 225
102 goa 200 400
102 punjab 200 450
102 mumbai 200 400
102 chennai 200 475
102 kerala 200 425
;
run;

SAS dataset:


Macro to generate sales report daily:


The SAS macro generates the sales stats and sends an email automatically without manual intervention.


%macro sales_report();

/* macro variable to capture yesterday's date*/
%let date=%sysfunc(putn(%eval(%sysfunc(today())-1),date9.));
%put &date.;

/* filter yesterday's sales data*/
data sales_fltr;
set sales;
where date="&date."d;
run;

/* Mention email id to which the report has to be generated. Modify the subject if required */

   filename temp email to="your_email@gmail.com"
            subject="Sales report - &date. "
            type="text/html";

   ods html body=temp;

   proc sql;
   select product_id,
    sum(product_cost) as total_cost,
    sum(product_revenue) as total_revenue,
    calculated total_revenue-calculated total_cost as profit
   from sales_fltr
   group by product_id;
   run;

   ods html close;

%mend;
%sales_report;

Email:


SAS output:


Monday, March 25, 2019

SAS Example : List the missing percentage of variables/columns of dataset

This post lists the missing percentage of all the variables in a dataset.


Below code to create sample data:


data sample;
input id name $;
cards;
1 anil
2 bob
3 arun
4 tarun
5 tom
5 paul
7 peter
8 krish
9 sai
10 gita
;
run;


Assign missing values. (name has 2 missing values and id has 1 missing value)


data sample1;
set sample;
if id>=9 then name='';
if name='tom' then id=.;
run;


Macro:


Below macro lists the missing percentage of variables in a dataset.


%macro list_misspct(input_dataset);

proc contents data = &input_dataset out = var_list noprint;
run;

proc sql noprint;
select count(*) into :total_obs from &input_dataset;
select count(*) into :var_cnt from var_list;
select name into :var_in separated by ' ' from var_list;
select type into :var_type separated by ' ' from var_list;
quit;

/*Creating dataset to hold variable names and their missing percentages*/

proc sql noprint; 
CREATE TABLE misspercentage
(Variable varchar(32),
missing_percentage int);
quit;

/*Computing missing percentage of variables*/

%do i=1 %to &var_cnt;

%let scan_var=%scan(&var_in,&i);
%let scan_type=%scan(&var_type,&i);

proc sql noprint;
create table miss_pct as
select "&scan_var" as variable,
sum(case when &scan_var is missing then 1 else 0 end) as miss_cnt,
((calculated miss_cnt/&total_obs)*100) as missing_percentage
from &input_dataset;
quit;

proc append base=misspercentage data=miss_pct(keep=variable missing_percentage) force;
run;

%end;

proc print data=misspercentage;run;

%mend list_misspct;

%list_misspct(sample1);


Note: Missing percentage calculation: count of missing observations/total no. of observation

Wednesday, February 13, 2019

Free SAS Tutorials: Dataset creation


Dataset

SAS dataset is generally in the form of table, i.e rows and columns. In SAS, rows are called observations and columns as variables.

Dataset creation

Below statements are used for creating a dataset:

  • DATA -  The DATA step always begins with a DATA statement. The purpose of the DATA statement is to tell SAS that you are creating a new data set i.e. outdata.
  • INPUT -  To define the variables used in data set.
  • Dollar sign ($) - To identify variable as character.
  • DATALINES - To indicate that lines following DATALINES statement a real data.
  • RUN - The DATA step ends with a RUN statement.


Example 1:


Data datasetname;
     input var1 var2 $;
     datalines;
      1 anil
      2 raj
      3 ravi
      4 neetu
      ;
run; 

Code:

Output:


Example 2:


data Test;    
input Item $ 1-6 Color $ 8-14 Investment 16-22 Profit 24-31;    
format Item Color $9. Investment  Profit  15.2;     
datalines; 
SHIRTS ORANGE  2431354 83952431 
TIES   BLUE    498432  2349123 
SUITS  BLUE    9482121 69839123 
BELTS  MAGENTA 7693    14893 
SHOES  MAGENTA 7936712 22956 
; 
run;

The highlighted input statement is another way of creating the variables by mentioning the position numbers.

Code:


Output:


Datasets are of 2 types: Temporary and Permanent

Temporary dataset:

These datasets are not available after the session is closed or ended. Usually they are saved in work library(a storage location where sas datasets are saved). 

The below 2 statements are equivalent.

data work.sample;
or
data sample;

Permanent dataset:

These datasets are saved in a location which can be used even after closing the sas session. Usually, these datasets are referenced as libref.dataset_name. Libref is a name that is temporarily assigned to a library. Library is storage where all the sas datasets are saved. 

A LIBNAME statement associates the libref with the SAS library. In the following PROC PRINT step, PROCLIB is the library reference and EMP is the SAS data set within the library:
libname proclib 'SAS-library';
proc print data=proclib.emp;
run;

Dataset creation using PROC SQL:


Proc SQL can be used for creating a dataset by connecting to Oracle database or from existing dataset.

Example: Creation of dataset sample from existing dataset i.e sashelp.cars

Proc sql;
create table sample as
select * from sashelp.cars;
quit;

Tuesday, January 22, 2019

SAS Example : Split dataset into n equally sized datasets


Considering the cars dataset available in sashelp and splitting it to 10 equally sized datasets.


Step1:

Creating a row number using _n_ system variable option.
           
               data sample;
                   set sashelp.cars;
                        n=_n_;
               run;


Step2:

The below macro splits the data into n equally sized datasets. n is passed as a parameter to the macro.
  • Macro name : split
  • creating a cnt macro variable which holds the no. of observation count of the cars dataset. Cars dataset has 428 observations, therefore cnt = 428 
  • number macro variable holds the no. of observations to be kept in each split dataset. In the below macro, cars dataset is split into 10 datasets. therefore number = 428/10 ~ 43 observations 
  • DO loop to iterate 10 times to split the cars dataset into 10 equally sized datasets. The split datasets are named as sample_1 to sample_10.

%macro split(divide);

         proc sql;
               select max(n) into :cnt from sample;
         quit;

         data split;
               num=ceil(&cnt/&divide);
         run;

         proc sql;
               select num into :number from split;
         quit;

         %do i=1 %to &divide;

                data sample_&i;
                     set sample;
                          if n>=((&i-1)*&number)+1 and n<=(&i*&number);
                run;

        %end;

%mend split;

%split(10);

Code:


Output:


Thursday, January 17, 2019

Statistics : Basics - Mean , Median and Mode

Arithmetic mean/Mean


It is the most common measure of central tendency. It serves as a balance point in a set of data. It is the only common measure in which all the values play an equal role. Mean is computed as sum of all the values divided by number of values in the data set. It is denoted by X-bar.


Example:

Age of students in class:
12 13 12 11 14 15 12 13 14

Mean=  ( 12 + 13 + 12 + 11 + 14 + 15 + 12 + 13 +14 ) / 9 = 116 / 9 = 12.88
Therefore, the average age is 12.8 ~ 13years


Median


Median is the middle value in an ordered array of the data that has been ranked from smallest to the largest. Half of the values are smaller or equal to the median, and half of the values are larger or equal to the median. In case of extreme values, median can be used as it is not affected.

Median has different calculation in case of odd and even data numbers.


Odd number of values

Median is the middle value of the sorted data

Example:
Age of students in class: 12 13 12 11 14 15 12 13 14

First sort the data : 11 12 12 12 13 13 14 14 15
Therefore, Median is 13


Even number of values

Median is the average of two middle values of the sorted data

Example:
Age of students in class: 12 13 12 11 14 15 12 13 14  12

First sort the data : 11 12 12 12 12 13 13 14 14 15 
Median = (12 + 13) /2 =12.5


Mode


Mode is the value that appears most frequently. Like the median and unlike the mean, it is not affected by the extreme values. For a particular variable, there can be several modes or no modes at all.

Example:
Age of students in class: 12 13 12 11 14 15 12 13 14 13

Since 12 and 13 has occurred 3 times, mode :12 & 13.


Comparison of Mean , Median and Mode


The determination of which average exactly suits for a specific variable depends on many factors. Certainly depends on the data level. Below are the valid averages for each level of data.

Nominal data => Mode
                   Ordinal data   => Mode and Median
                               Interval data  => Mean, Median and Mode 
                              Ratio data      => Mean, Median and Mode

For a symmetrical distribution, all the three measures  mean, median and mode are exactly same in value.
i.e, Mean = Median = Mode

Geometric Mean

When you want to measure the rate of change of the variable over time, you need to use the geometric mean instead of arithmetic mean. It is computed as nth root of product of n values.

Harmonic Mean

It is also a mathematical average. It is the reciprocal of the average of  the reciprocal of the values i.e number of values divided by sum of its reciprocals.

Example:
The time taken by 3 teams for designing a caption are 6,3 and 8min. For computing the average rate of designing the caption is

XH= 3 / (1/6 + 1/3 + 1/8) = 3/(15/24) = 24/5 = 4.8min

Arithmetic mean would be X=6+3+8/3 = 5.6min

Harmonic mean will always be less than arithmetic mean.

Sunday, January 6, 2019

Free SAS Tutorials : Basics of SAS programming

SAS stands for STATISTICAL ANALYSIS SYSTEM


SAS software (Click here for free SAS software access)

SAS has 3 windows:
  1. Editor/code window : A place where we write our codes/programs.
  2. Log window : All the executed SAS codes are printed in this window along with any error or warning messages. A PUT statement can be used to print the output in the log window.
  3. Output window(non default window) : Appears only where there is an output from the sas program mostly whenever a dataset is created(dataset is a sas file which has data in the form of rows(observations) and columns(variables)).
  4. Result window : Place where we can see the result from the sas code which is only viewed but is not saved.

Editor/code window


Log window


Output window


How does a SAS data looks like?


A SAS data set contains data values that are organized as a table of observations (rows) and variables (columns) that can be processed by SAS software.

The below image has 4 variables i.e, name, age, height and weight and 3 observations.


SAS Components

  •  Base SAS – Basic procedures and data management 
  •  SAS/STAT – Statistical analysis 
  •  SAS/GRAPH – Graphics and presentation 
  •  SAS/ETS – Econometrics and Time Series Analysis 
  •  SAS/INSIGHT – Data mining 
  •  Enterprise Miner – data mining 
  •  Enterprise Guide - GUI based code editor & project manager 
  •  SAS EBI - Suite of Business Intelligence Applications 

Basic SAS programming guidelines:

  1. Each statement ends with a semicolon.
    • Example: Data sample; Input id;
  2. A single statement can be written in multiple lines or multiple sas statements can be written in single line.
  3. SAS statements are not case sensitive.
  4. Every data step and proc step should end with RUN statement and proc sql should end with QUIT statement
    • Example - data step: Data sample;var1=10;run;
    • Example - proc step: proc print data=sample;run;
    • Example - proc sql;select * from sample;quit;
  5. All the sas variable names should be between 1 to 32 characters.
  6. SAS variable names can start with a underscore (_) or character but cannot start with number. Blank spaces and few special characters like $,%, & are not allowed in the variable names.
  7. SAS code comments are specified in two ways. 
    • commenting starts with  asterisk(*) and ends with semicolon(;) --- * comment ;
      • Example: 
      • * mention the comments;
      • * comment line 1
                              * comment line 2;
    • commenting starts with /* and ends with  */ --- /* comment */
      • Example:
                              /* comment line 1
                                  comment line2
                                  comment line 3 */

SAS Programming:

Every sas code starts with either a DATA step or PROC step

DATA step

  • Data step starts with keyword DATA and ends with RUN statement
  • One of the way to create a dataset
  • Data step is used to get the data from a raw file like excel ,text etc. 
  • It is used to manage the data, create new variables, transform the data.
  • Create variables and observations
Sample code:


Output:


PROC step

  • Proc step starts with keyword PROC and end with RUN statement.
  • Proc steps are nothing but inbuilt procedures available in SAS. 
  • These are used to analyze the data, view the data and generate reports.
Sample code:


Output:


Tuesday, December 18, 2018

Free SAS tutorials: SAS software without installation

SAS OnDemand for Academics is the free software and no installation is required. Internet is required as it runs on cloud and can be accessed for anywhere.


Steps for accessing SAS OnDemand for Academics:


  1. Register yourself by clicking on the link: SAS Registration
  2. Enter your First Name, Last Name, and Email Address in the form. Select the Country in which you reside. Click Submit.
  3. You will receive an email from SAS team for activation of your profile
  4. Clink on the link and set your password by mentioning your email id
  5. You will receive another email with your user id and the link to access SAS Studio

Click on the link to sign in: Sign In to SAS

Once you login the below screen appears:


Advantages of the software:

  • Its free
  • Can be accessed for everywhere
  • No installation is required

The following products are available on the software:

  • Base SAS
  • SAS/STAT software 
  • SAS/GRAPH software
  • SAS/ETS software 
  • SAS/OR software, including OPT, PRS, IVS, and LSO 
  • SAS/IML software 
  • SAS/CONNECT 
  • SAS High-Performance Forecasting 
  • SAS/ACCESS Interface to PC Files 
  • SAS/QC software

Browsers supported:

  • Microsoft Internet Explorer 9, 10, and 11 (Microsoft Internet Explorer 10 or later is recommended for certain features, such as the ability to drag and drop files) 
  • Mozilla Firefox 21 or later 
  • Google Chrome 27 or later 
  • Apple Safari 6.0 or later (on Mac OS X) 


Please feel free to drop your comments. If you need 1-1 online training on data science, SAS & SQL, drop a comment below.


Subscribe for Email to get free updates on Data Science.

Monday, December 17, 2018

Data Science summarized in ONE picture


Please feel free to drop your comments. If you need 1-1 online training on data science, SAS & SQL, drop a comment below.


Subscribe for Email to get free updates on Data Science.

Wednesday, December 12, 2018

Case Study : CHICAGO CRIME DATA ANALYSIS

Problem Statement:  

The below location has historical crime data in the state of Chicago.   The data has different co-ordinates like location,date/time,address,zipcode etc. The requirement here is to provide visual insights dashboard from the existing data for better prevention and policing. You can use any visualization tool as you wish.

Solution:

Business Analysis:

There are many visualization tools available in the market. I have utilized Tableau for the visualisation. For insights into this data, I have done the below visualisation charts.  
    • Crimes Trending Analysis : The goal is to understand the period during which there are more crimes than the rest of periods.
    • Type and Location Trends :  Top 5 locations with more crimes. 
    • Location Analysis :   Sub-location crime analysis. Goal is to understand where exactly the police have to pay attention to during patroling.
    • Type Analysis : Different Types of crimes at different locations.
    • Geo Analysis:  This is a good geo chart with spots to identify the location analysis.
    • Zipcode Analysis: Crime Analysis by zipcode.
    • Community Area Analysis : Identify top few communities with crime rate.
    • Arrest Analysis: Provide insights where arrests are happening. The police can compare arrests analysis vs geo analysis and streamline their operations accordingly.

 Visualisation Outputs:


From the graph we can understand that the Theft is happening mostly on the Streets and Battery on Sidewalk, Residence and apartments etc


Summary:


From the above graphs, below insights can be drawn:
  •      Most of the crimes are happening in the mid of the year i.e. May, June, July, August and during the evening hours which is after 6PM and also observed crimes happening during noon.
  •     60% of the crimes are happening in these locations: Streets, Residence, Apartment and Sidewalk.
  •      60% of the crimes are theft, battery, criminal damage, narcotics
  •      Need to concentrate on the beats per each zipcode or district
  •      Police to concentrate more on the arrest performance and also to find new techniques to arrest criminals. Only 26% of the criminals are arrested in 2015

Where should Chicago Police Focus?

  • Type Vs Location focus?
    • Street <=> Theft
    • Apartment <=> Battery
    • Sidewalk <=> Narcotics
  • Which places to focus?
    • Zipcode: 0000X, 001XX, 002XX
    • Community: 25
  • When to have increased Policing
    • May - October :12:00 PM, 18:00  - 21:00
    • Arrests : Focus on all types excluding Narcotics


      Statistical Modeling ideas:

      •        Considering the past/historic data i.e. 15years to predict the crime in future.


      •        Few of the advanced analytics we can perform are :
        •        Clustering,
        •        Hypothesis testing
        •        Trending analysis
        •        Pattern Detection


      •        Identifying the trends in the crimes can help police monitor on those areas.


      •        Logistic regression can be used to predict if a person is criminal or not.


      •        Pattern analysis can help in identifying the patterns followed by criminals.


      •        Model can be built to predict the occurrence of crime.


      •        Data required for more analysis:
        •        Information on criminal age and background, gender, race can help in identifying the crime trends.
        •        Census data to understand the population by area. Using this data we can understand the crime and population relation.


      Please feel free to drop your comments. If you need 1-1 online training on data science, SAS & SQL, drop a comment below.


      Subscribe for Email to get free updates on Data Science.


      Top 25 most frequently asked SAS interview questions and answers


      1. What is the Program Data Vector (PDV)? What are its functions?
      • The function is to store the current obs. PDV (Program Data Vector) is a logical area in memory where SAS creates a dataset one observation at a time. When SAS processes a data step it has two phases. Compilation phase and execution phase. During the compilation phase the input buffer is created to hold a record from external file. After input buffer is created the PDV is created. The PDV is the area of memory where SAS builds dataset, one observation at a time. The PDV contains two automatic variables _N_ and _ERROR_.The Logical Program Data Vector (PDV) is a set of buffers that includes all variables referenced either explicitly or implicitly in the DATA step. It is created at compile time, then used at execution time as the location where the working values of variables are stored as they are processed by the DATA step program

      2. Difference between IF and Where:

      • IF : it can only be used in a DATA step. Many IF statements can be used in one DATA step. Must read the record into the program data vector to perform selection with IF
      • WHERE: can be used in a DATA step as well as a PROC. A second WHERE will replace the first unless the option ALSO is used. Data subset prior to reading record into PDV.


      3. Ways to create macro variable
      • In addition to the %LET statement, other features of the macro language that create macro variables are:
        • iterative %DO statement
        • %GLOBAL statement
        • %INPUT statement
        • INTO clause of the SELECT statement in SQL
        • %LOCAL statement
        • %MACRO statement
        • SYMPUT routine and SYMPUTN routine in SCL
        • %WINDOW statement

      4. How to convert rows to columns/ columns to rows in SAS
      • Proc TRANSPOSE is used to to convert the data

      5. What is the difference between using drop = data set option in data statement and set statement?
      • If you do not want to process certain variables and do not want them to appear in the new dataset, then mention the drop=  option in the SET statement. 
        • Example: set datasetname(drop= var1 var2);
      • If you want to process certain variables and do not want them to appear in the output dataset, then mentopn the drop= option in the DATA statement.
        • Example: Data newdatasetname(drop=var1 var2);

      6. What is the difference between "+" operator and SUM function?
      • "+" operator returns the output as missing if there are any missing values in the data
        • Example: Y= 3 + . + 2 output: Y=.
      • SUM function returns the sum of non missing values even if there are missing values in the data
        • Example: Y= sum(3 , . ,2) output: Y=5

      7. How many datatypes are there in SAS?
      • We have 2 datatypes in SAS: 
        • Numeric
        • Character
      • Date is considered as numeric datatype.


      8. How to remove duplicate observations in SAS?
      • Here are the few techniques to remove duplicates:
        • Using 'Nodup' or 'NodupKEY' option in proc sort
          • Example: Proc sort data=datasetname Nodup; by var1; Run;
        • Using first. and last. option
          • Example: 
                                      data datasetname;
                                      set inputdata;
                                      by id;
                                      if first.id and last.id;
                                      run;

              9. What is the difference between input and put function in SAS?
              • Put : converts numeric to character
                • Example:
                                      data put_function;
                                          pincode_num= 123456;
                                          pincode_char= put(pincode_num, 6.);
                                      run;
              • Input :  converts character to numeric
                • Example:
                                        data input_function;
                                            salary_char= '12345678';
                                            salary_num= input(salary_char, 8.);
                                        run;     


                  10. What is the default length while using scan function?
                  • 200 length

                  11. Name few SAS functions that you worked on?
                  • substr
                  • find
                  • intnx
                  • intck
                  • index
                  • catx 
                  • sun
                  • alnum
                  • scan

                  12. How do SAS dates  work?
                  • SAS date is stored as numeric value. Jan 1, 1960 has the sas date value as 0. Any date after this is the no. of days from this date. Example, Jan 1, 1961 is 366.

                  13. What are the default option of proc means?
                  •  n, mean, minimum, maximum, standard deviation

                  14. What the few procedures that you worked on?
                    • Proc SORT : Sorts the data by the variable mentioned in the by statement. Using nodupkey, we can remove duplicates.
                    • Proc APPEND : Adds one dataset to another. 'force' option to be used when the variables are of different length in two datasets

                    15. What is the difference between nodupkey and nodup in sort procedure?
                    • The identical observations are checked and removed through NODUP option. NODUPKEY option checks for all BY variable values and if found, it will eliminate that.

                    16. What is the difference between VAR V1 – V3 and VAR V1 -- V3?
                    • VAR V1 - V3 would return V1, V2 and V3 variables
                    • VAR V1 -- V3 would return all the variables between V1 and V3. 
                      • For example, there are 5 variables i.e. V1 name id V2 V3, then all the variables between V1 and V3 would be returned

                    17. What is the difference between format and informat?
                    • An informat is a specification for how raw data should be read. 
                    • A format is a layout specification for how a variable should be printed or displayed.

                    18. Explain why double trailing @@ is used in Input Statement?

                    • During data step iteration, including double trailing @@ in Input statements implies that SAS should hold the current record for the purpose of execution of next Input statement rather than switching onto the new record

                    19. Explain data _null_?
                    • DATA statement processes all statements within the DATA step without dataset creation

                    20. What is the difference between Proc MEANS and Proc SUMMARY?

                    • Proc Means: This procedure produces the printed report by default in the OUTPUT window. By default take all the numeric variables in the analysis.
                    • Proc Summary: This procedure includes the PRINT in the statement to produce the printed report. It takes the variables into the statistical analysis that are described in VAR statement.

                    21. Mention SAS system options to debug SAS macros.
                    • MLOGIC
                    • MPRINT
                    • SYMBOLGEN


                    22. What is the difference between SYMPUT and SYMGET?


                    • SYMPUT: used for storing the value of a data set into the macro variable.
                    • SYMGET: used for retrieving the value from the macro variable to the data set.

                    23. What are the programming errors that you committed?
                    • Not checking log after submitting program
                    • Missing semicolon
                    • run statement instead of quit in proc sql

                    24. What is the difference between the SAS DATA STEP and SAS PROCs?
                    • SAS DATA STEP is used to read in and manipulate data.
                    • SAS PROCs are sub-routines perform tasks on SAS data set.

                      25. what is the use of %include statement?
                      • %INCLUDE statement reads an entire file into the current SAS program you are running and submits that file to the SAS System immediately.


                      Please feel free to drop your comments. If you need 1-1 online training on data science, SAS & SQL, drop a comment below.


                      Subscribe for Email to get free updates on Data Science.